Circumventing a physical law to better understand breast cancer.
July 2026
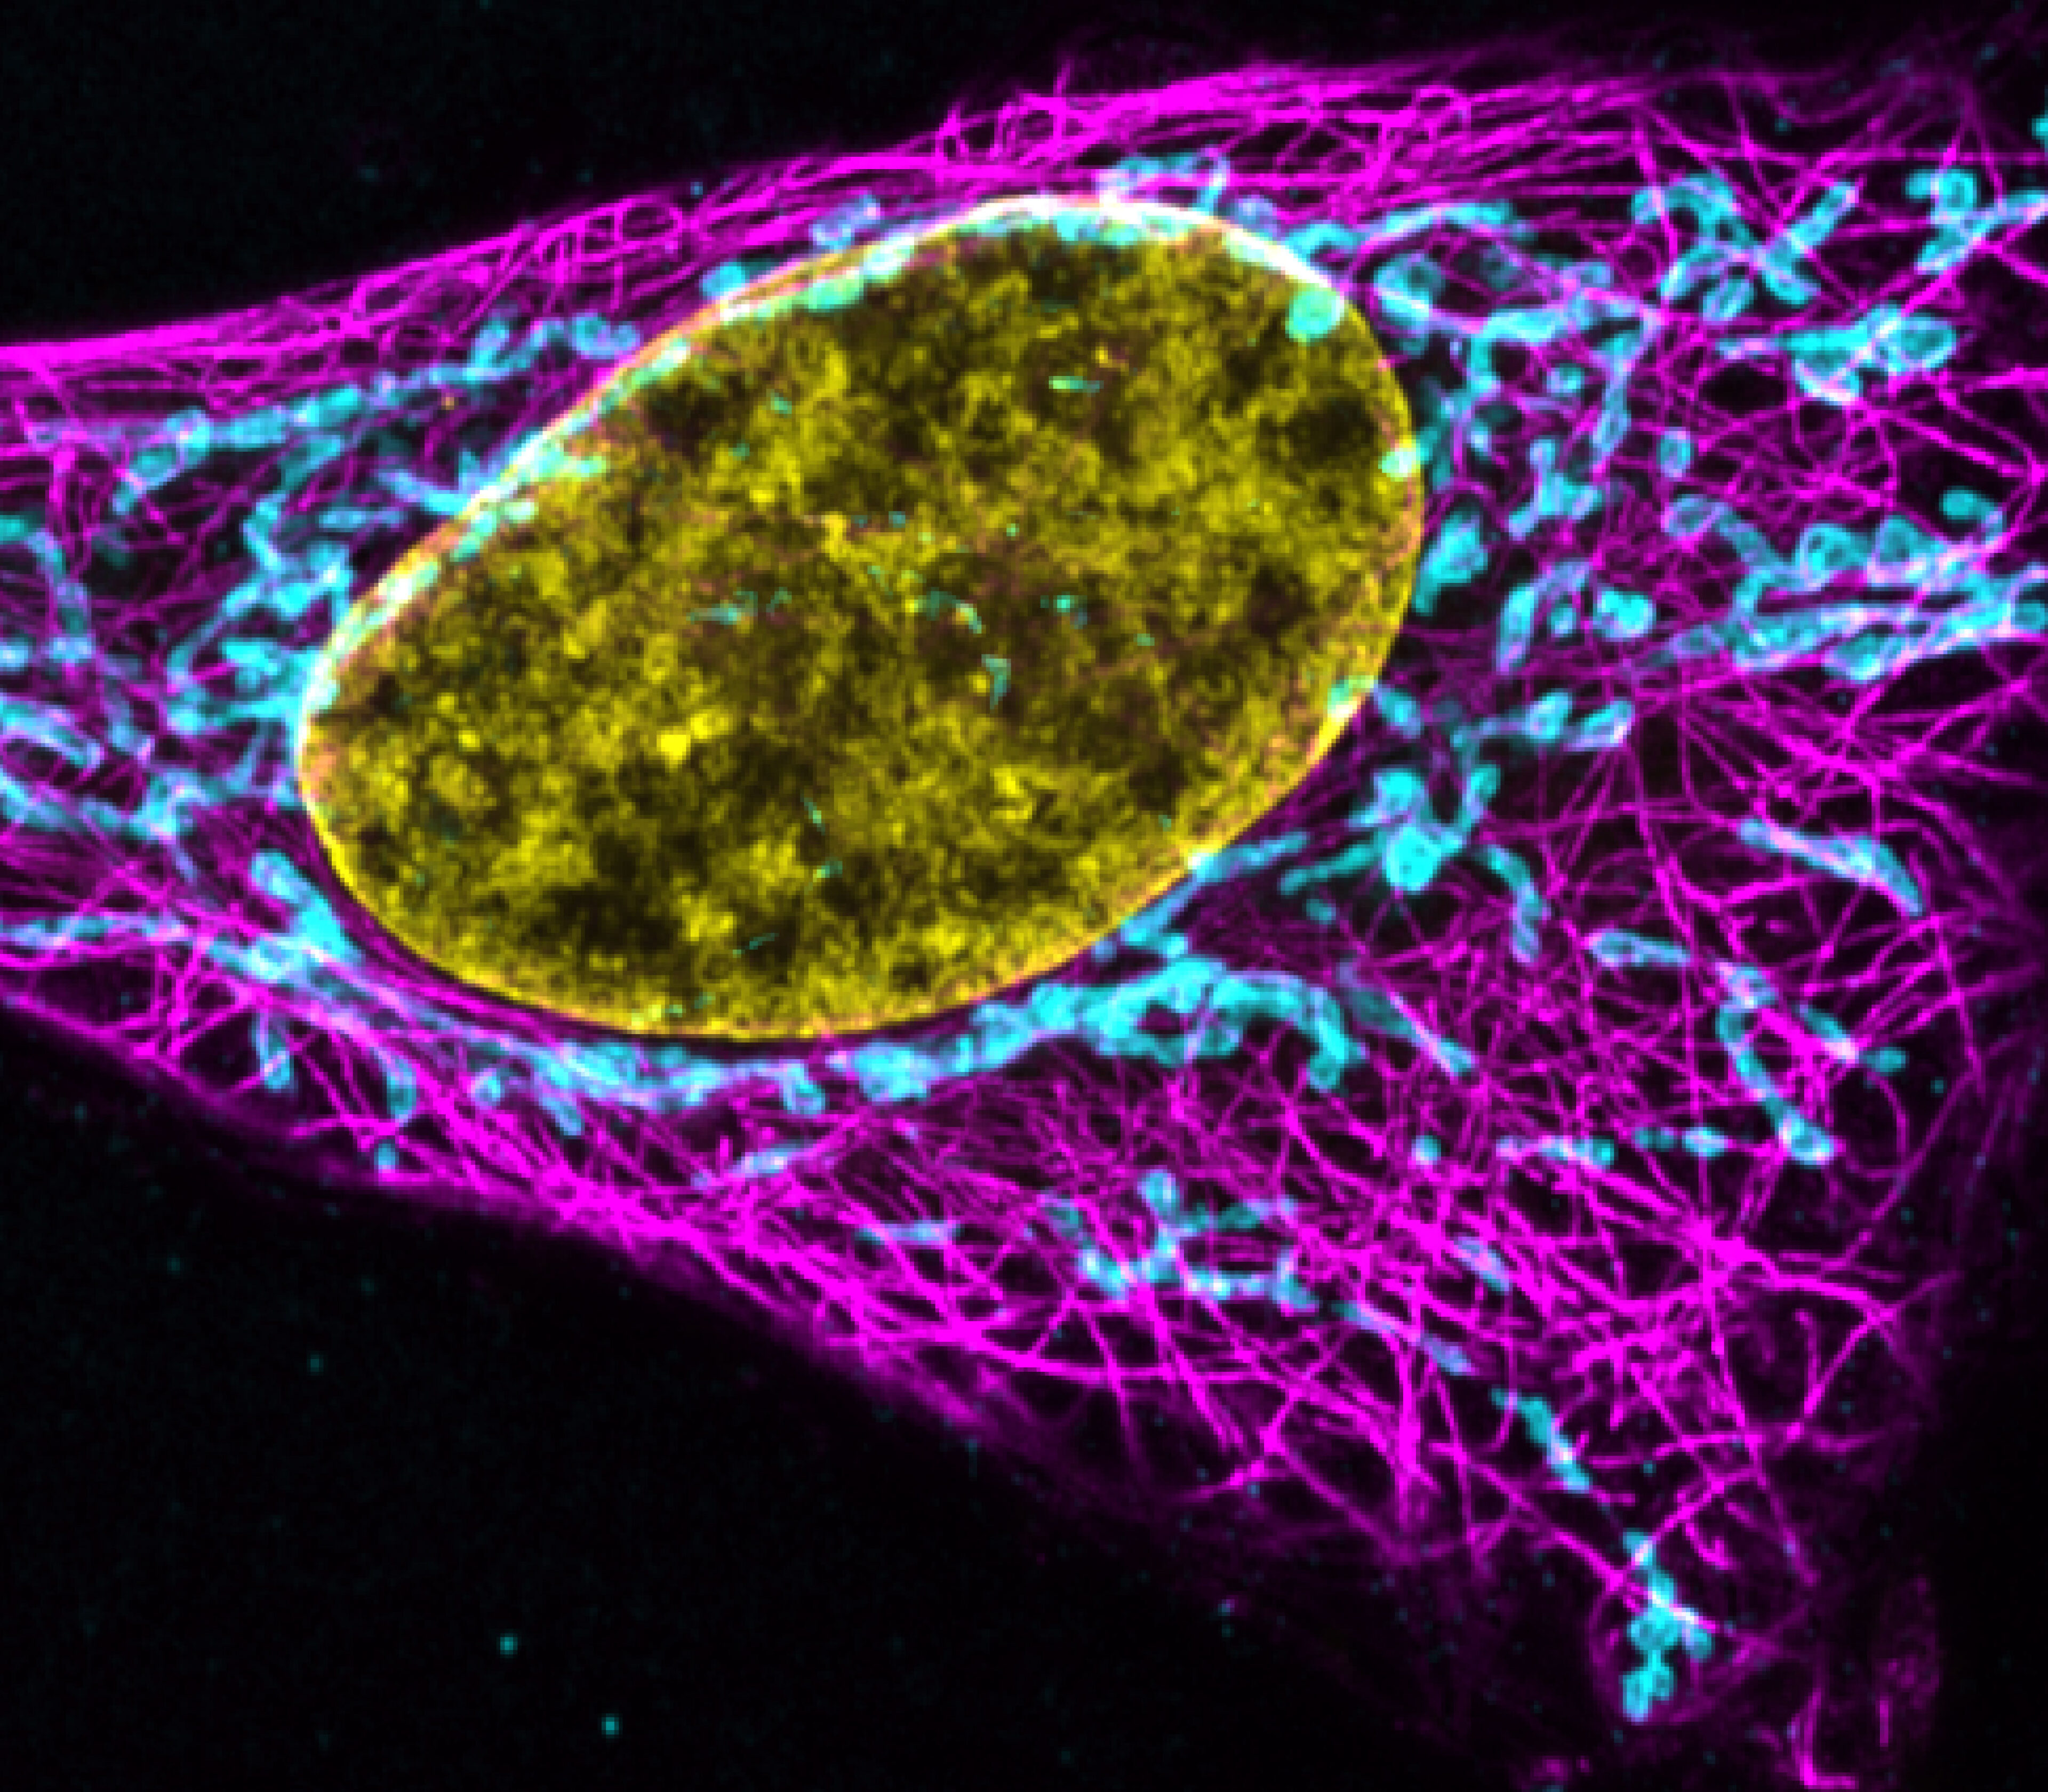
In 1665 the Royal Society published its first book, Micrographia, in which Robert Hooke used a visible light microscope to observe the minute bodies that form cork. He called these cells. In this single publication, Hooke discovered the fundamental unit of life and developed one of the most powerful tools to study it. Scientists built on this for centuries, improving optics and identifying dyes that enhanced contrast between the translucent biological specimens and their surroundings. The pursuit of contrast eventually led to a major conceptual change – instead of capturing light transmitted through the sample, which is disturbed or blocked, label the sample with a fluorescent molecule that emits light upon excitation with light of a fixed wavelength. This yields a bright fluorescent specimen surrounded by a dark nonfluorescent background (Figure 1). Now a cornerstone of biomedical research, fluorescence microscopy is rich in imaging approaches and methods to label extensive sample types, from nanoparticles to cultured cells and living tissue.
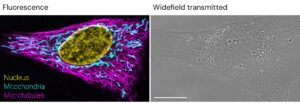
Figure 1: Comparison of fluorescence and transmitted light microscopy. Left Immunofluorescence microscopy image of a HeLa cell stained with DAPI (nucleus, yellow) and antibodies against α-tubulin (microtubules, magenta) and TOM20 (mitochondria, cyan). Right Widefield transmitted light image of the same HeLa cell.
Traditionally, fluorescence microscopy has explored biology at the micrometre scale, capturing the dynamic behaviour of cells and their constituent organelles. But this is not the limit of biological organisation; there is a 1000-fold smaller nanometre-level network containing millions of interacting molecules that direct these micron-level phenotypes. Posing the question: if single molecules can be easily labelled with fluorescent proteins or antibodies bound to dyes, why did the field halt at micrometre visualisation, ignoring this nanoscale world foundational to health and disease? The reason is fundamental, found not in biology, but in a barrier defined by optics and photon physics.
This barrier is called the diffraction limit and sets an absolute restriction on the resolving power of fluorescence microscopes. Because light propagates as a wave, microscopes cannot perfectly converge emission from a point source, such as a fluorescent protein, into an infinitely small point. Instead, the light diffracts, forming a blurred focal spot called an Airy disk (Figure 2a,b). When two fluorescent molecules are closer than approximately 250nm their Airy disks overlap and become indistinguishable (Figure 2c). These molecules are said to be diffraction limited. Therefore, in a typical biological sample where many thousands of crowded molecules are labelled, this overlapping fluorescence obscures fine molecular detail and seemingly precludes nanoscale investigation.
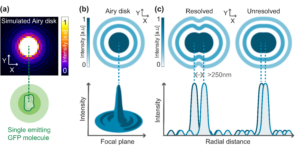
Figure 2: The diffraction limit. (a) Simulated Airy disk depicting the x-y intensity profile observed when light from a point source, such as a single fluorescent protein, diffracts at the focal plane. (b) Schematic showing the fluorescence intensity profile of an Airy disk. (c) When two fluorescent molecules are closer than ~250nm, their Airy disks overlap and become indistinguishable. These molecules are said to be diffraction limited.
Yet, resolution theory assumes all fluorophores in a sample are emitting simultaneously, so why not bypass this issue and image sequentially? This Nobel Prize winning concept, turning single fluorophores on and off to localise their position then integrating this information into a single image, gave rise to a super-resolution approach called single molecule localisation microscopy (SMLM) and increased the resolution of fluorescent imaging by up to three orders of magnitude (Figure 3). At Medicines Discovery Catapult(MDC) we use a modified SMLM technique called direct stochastic optical reconstruction microscopy (dSTORM). Here, specialist buffers and illumination strategies are used to induce on-off fluorophore blinking, allowing the molecular architecture of samples to be mapped with nanometre precision. Given the potential value contained in such insight, a key aim is the application of dSTORM to better define disease states and interventions in clinical samples.
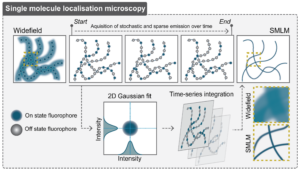
Figure 3: Single-molecule localisation microscopy. In SMLM, fluorophores are switched on and off over time, allowing the emission from a randomly distributed and sparse subset of molecules to be captured in each frame. The centroid position of each fluorophore is determined by Gaussian fitting, then integrated to form a single super-resolved image.
To guide treatment in breast cancer, biopsies are assessed for the status of a receptor tyrosine kinase called human epidermal growth factor receptor 2 (HER2). HER2 is overexpressed in 15-20% of breast cancers and is associated with a poor prognosis and aggressive phenotype if left untreated. Nevertheless, anti-HER2 therapies such as the monoclonal antibody trastuzumab have revolutionised the treatment of HER2-positive breast cancer and greatly improved outcomes for patients. Access to these targeted therapies depend on a tumour’s HER2 expression, which is assessed by staining of biopsies. Based on this staining, the tumour is assigned one of four grades (0, 1+, 2+ or 3+), with 3+ and a subset of 2+ receiving anti-HER2 therapy. Recent clinical data has questioned whether this method is sufficient for identifying all patients that could benefit from targeted therapy. While high expressors are well-captured, quantitatively describing HER2 heterogeneity in low expressing cohorts for stratification is largely out-of-reach. This necessitates the development of new highly sensitive approaches driven by analysis of HER2 organisation in patient tissue.
To begin addressing this challenge at MDC, we used dSTORM to map the nanoscale organisation of HER2 in tumour tissue isolated from patients spanning all four grades. This revealed that HER2 molecules adopt a clustered localisation, where proteins are arranged in discrete groups rather than distributed uniformly (Figure 4a). Quantification of this clustering phenotype only showed changes at the extremes, for example, when comparing 1+ with 3+ samples (Figure 4b,c). This was unexpected as HER2 is well-understood to be progressively amplified from low to high grades, suggesting that assigned grade might not capture the complexity of HER2 nano-organisation. To explore this further, we applied a data-driven approach using Earth Mover’s Distance, a mathematical measure of the effort required to transform one spatial distribution into another, to group samples into four classes based on the architecture of HER2 molecules within clusters (Figure 4b-d). Following reclassification, which occurred across all grades, a progressive increase in cluster area and HER2 molecules per cluster was observed between all classes (Figure 4b,c).
What could this mean for patients? By looking beyond the diffraction limit, we have established a method to quantitatively distinguish low-grade breast cancers that appear identical by traditional means. Ultimately, this nanoscale insight could expand access to novel HER2-targeted therapies by reliably identifying low expressing cohorts that would benefit from intervention.
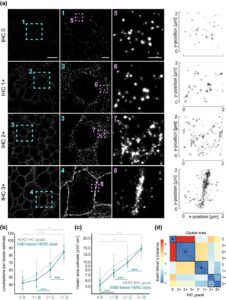
Figure 4: Classifying breast cancer tissue with HER2 nanosignatures. (a) Left Gaussian rendered dSTORM images of clinical breast cancer tissue spanning all four IHC grades. Zoom boxes depict regions of HER2 molecular clustering. Scale bars 10μm, 2μm, and 500nm. Right Plots showing the individual HER2 localisations used for analysis and to generate the Gaussian renders. (b) The number of HER2 localisations per cluster when samples are grouped by IHC-assigned grade (grey) and by EMD-assigned grade (blue). (c) Quantification of cluster area when samples are grouped by IHC-assigned grade (grey), and by EMD-assigned grade (blue). Distributions were compared using a Linear Mixed-Effects model with Tukey HSD test. p ≤ 0.05 (*), p ≤ 0.01 (**), p ≤ 0.001 (***). (d) The EMD-based data-driven grouping of the samples into A, B, C and D.
MDC’s super-resolution microscopy platform maps molecular organisation at nanometre precision, from single molecule localisation to clinical tissue analysis. Combined with our RNA therapeutics capabilities, we can take your programme from biological insight to delivery.


How to study the endosomal escape of RNA therapeutics
Xenium at MDC Case Study: Hypoxia in Head and Neck Cancer
From mitochondrial networks that silently rebalance fusion and fission, to chromosomes that only reveal their fate in the minutes after division, live-cell imaging uncovers dynamics that static snapshots miss entirely. We explore three examples, including how tracking RNA therapeutic vehicles as they transit and escape endosomal compartments in real time resolves ambiguity that even super-resolution imaging of fixed cells can’t overcome.