At Medicines Discovery Catapult we like to collaborate and help young data scientists get into pharma.
“The best minds of my generation are thinking about how to make people click ads. That sucks.” – Jeff Hammerbacher
That’s why we have partnered with University of Sheffield Data Analytics MSc. Providing a project and dataset that will give students a chance to experience challenges faced in an industry data science scenario.
Traditional information extraction / retrieval approaches, for scientific literature, have focussed mostly on text content, which is easily accessible and requires little additional processing. In recent years, heralded by the “deep learning” boom, which has seen massive strides in the image analysis field, eyes have turned to an area of scientific literature that has remained relatively untouched by automatic methods: figures.
Tables and figures, in scientific publications, are invaluable tools. Providing authors with a mechanism to convey large amounts of complex information to the reader, that would otherwise be difficult to explain, or illustrate, with text alone. The lack of tools to search for specific figures represents a problem in retrieval of scientific information. Papers containing information “hidden” in figures are less likely to appear in searches, and by extension literature reviews.
The data: Types of scientific figure
Tables allow large amounts of information to be displayed in a well-structured and easy to interpret fashion. Figure 1, below, displays all variables in a model of human response to insulin and glucagon in diabetic patients, a dense body of information which would be very difficult to display with a set of paragraphs in the main body.

Charts/graphs are a graphical representation of a set of data such as a numeric table, or even a mathematical function. A typical chart will have an associated title or caption to convey the contents of the chart, axes labels to ground the coordinate system, and often a legend to explain the symbols used. Figure 2, below, is a good example of how multiple figures/tables can come together to tell a story. The table, figure 1, informs the reader of the variables in the model, and the chart, figure 2, shows how the models respond to different values for the variables. A relationship that could be explained in text, but is immediately obvious when shown on a chart.
.
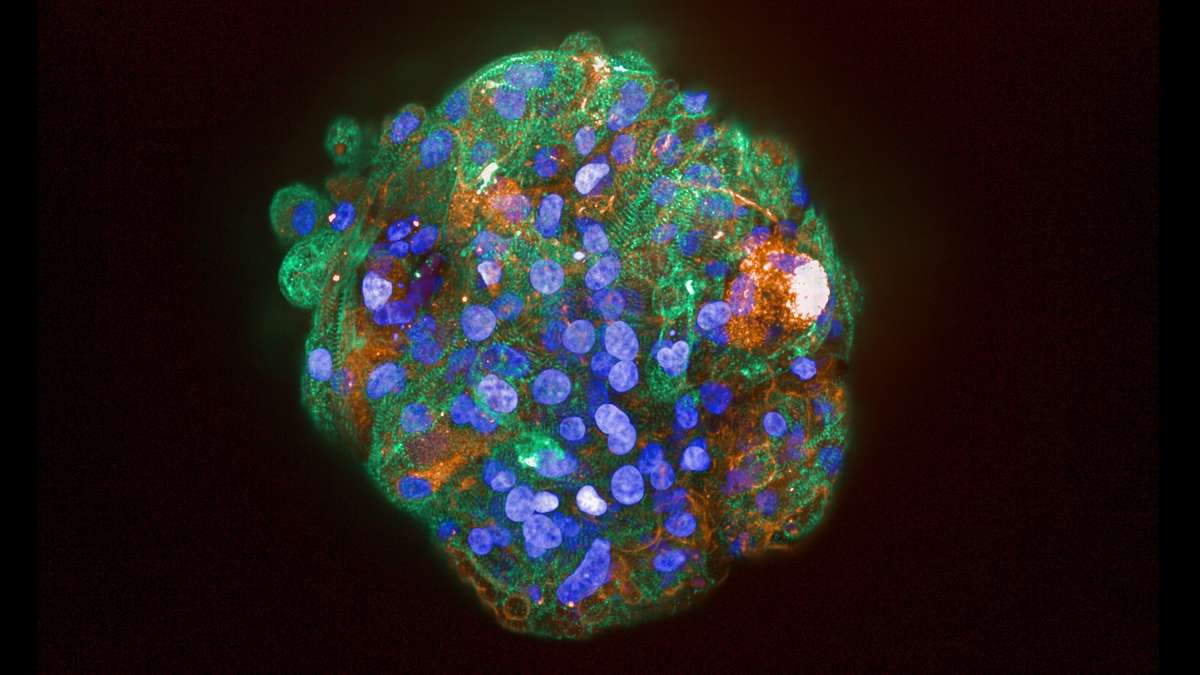
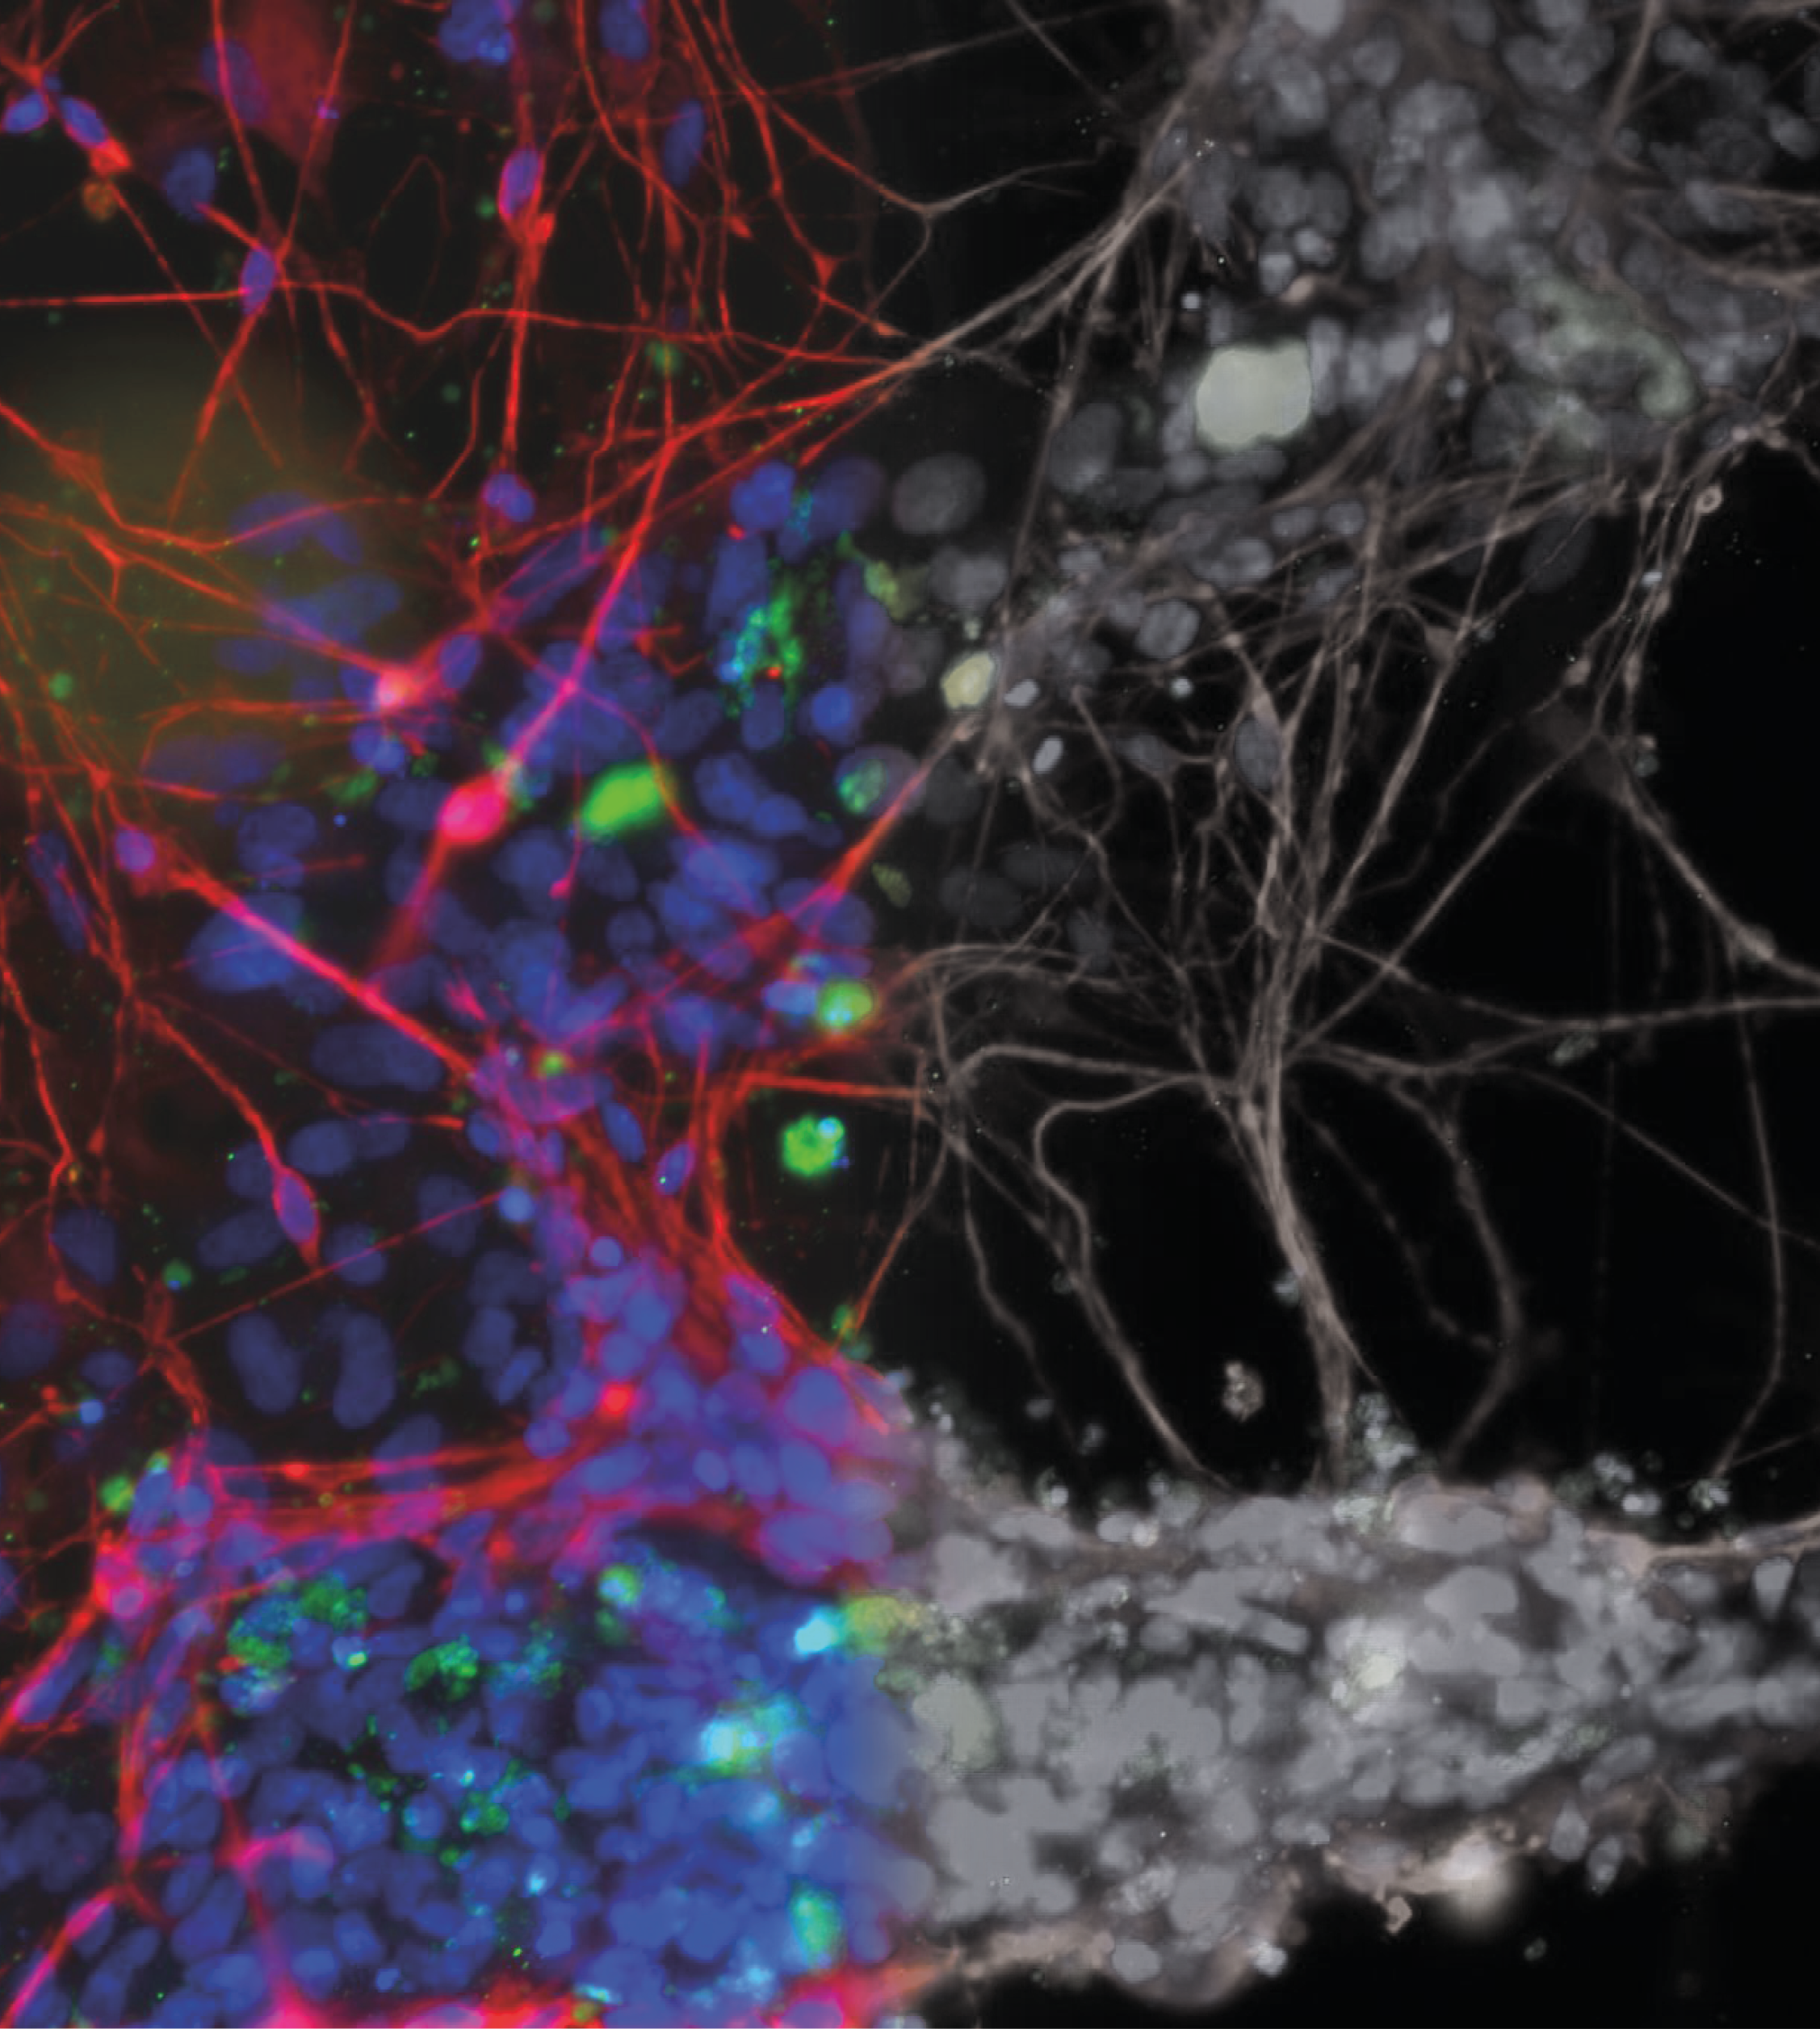
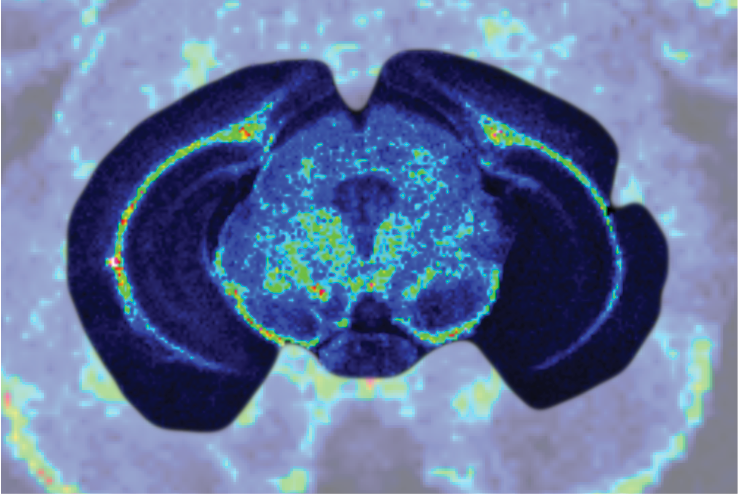
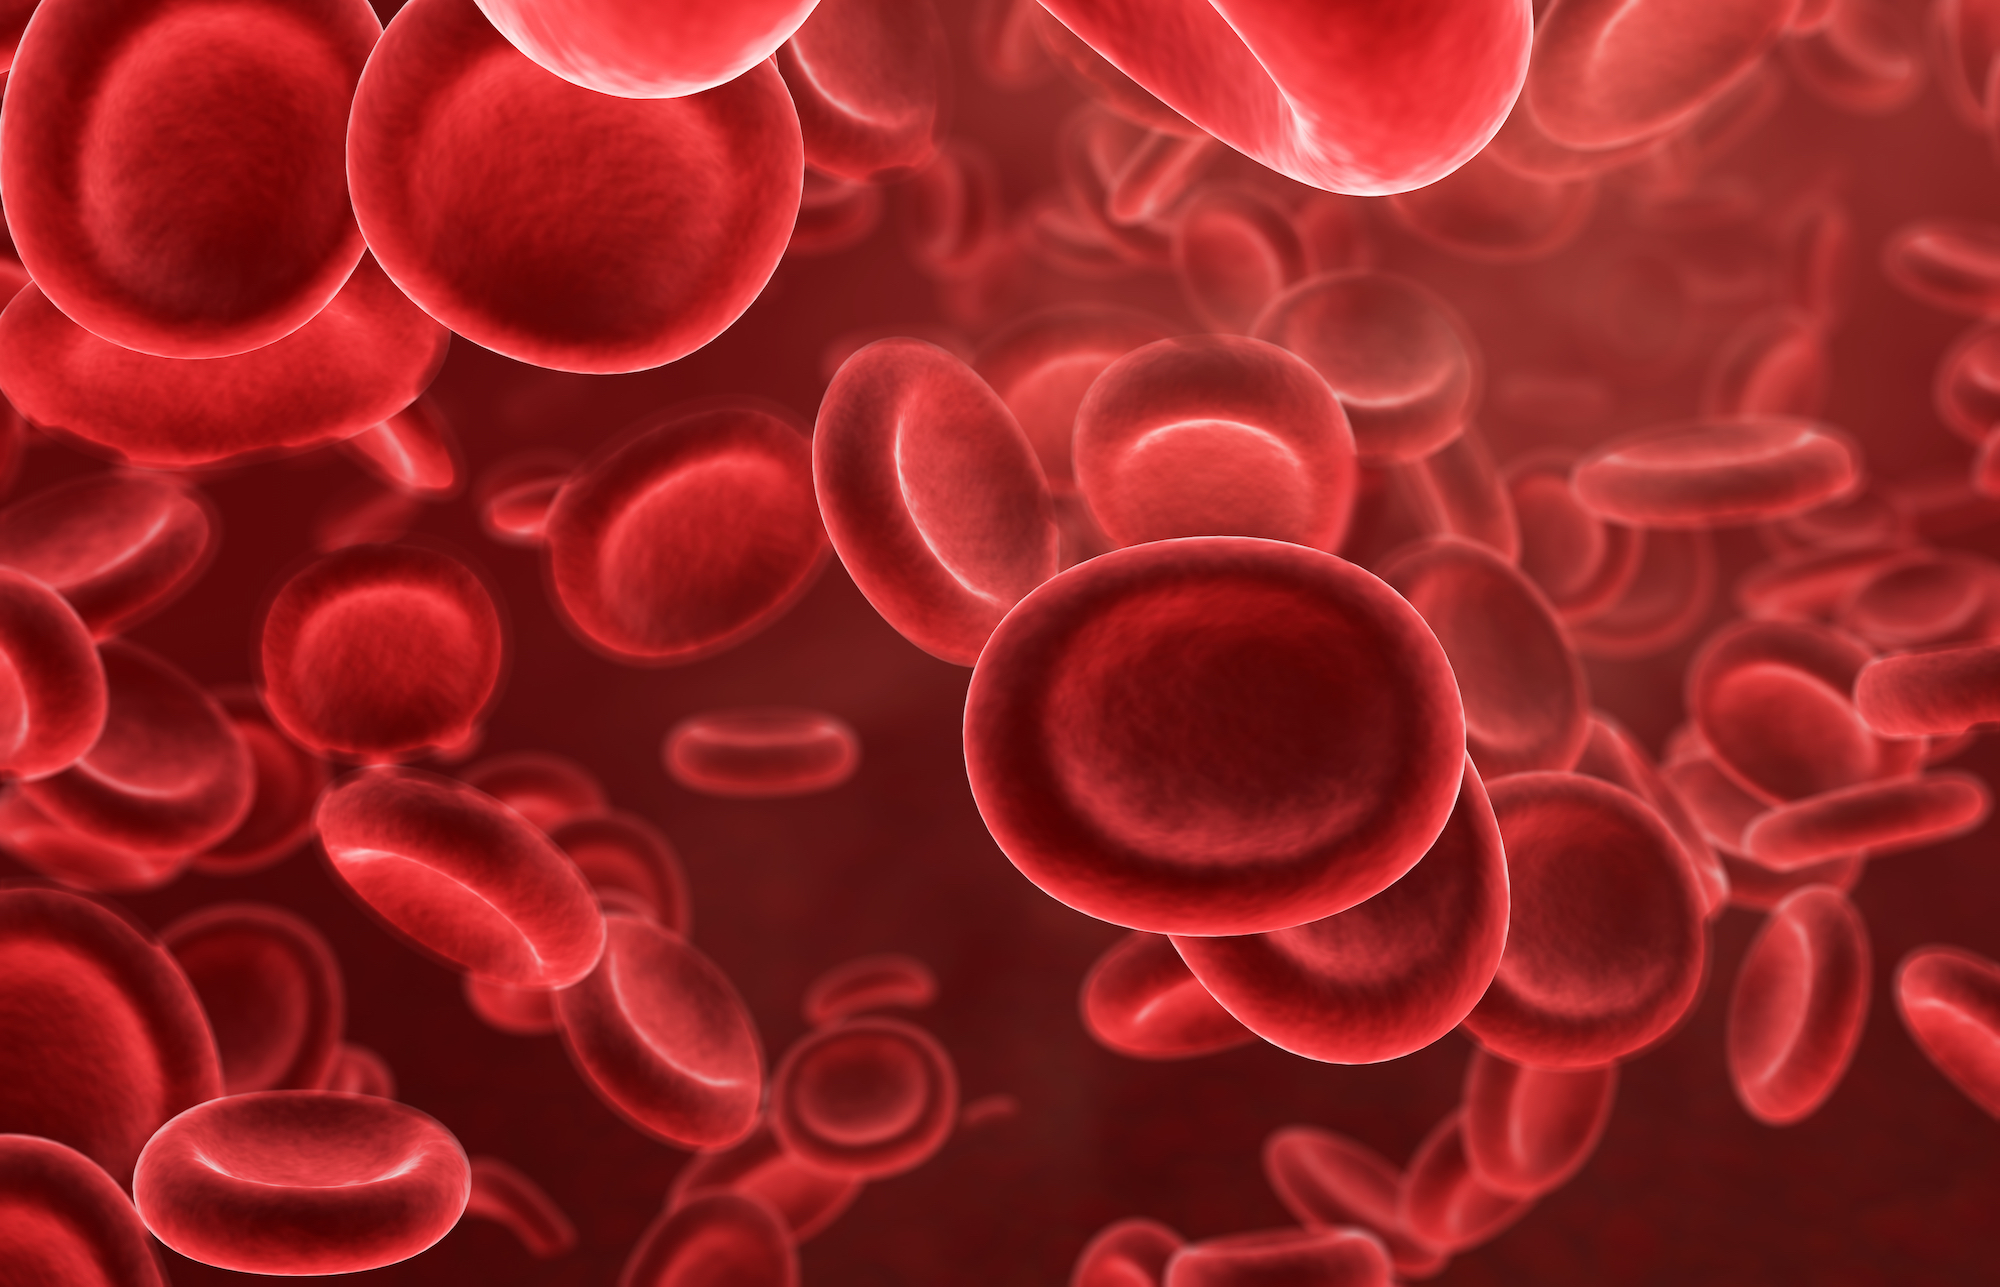
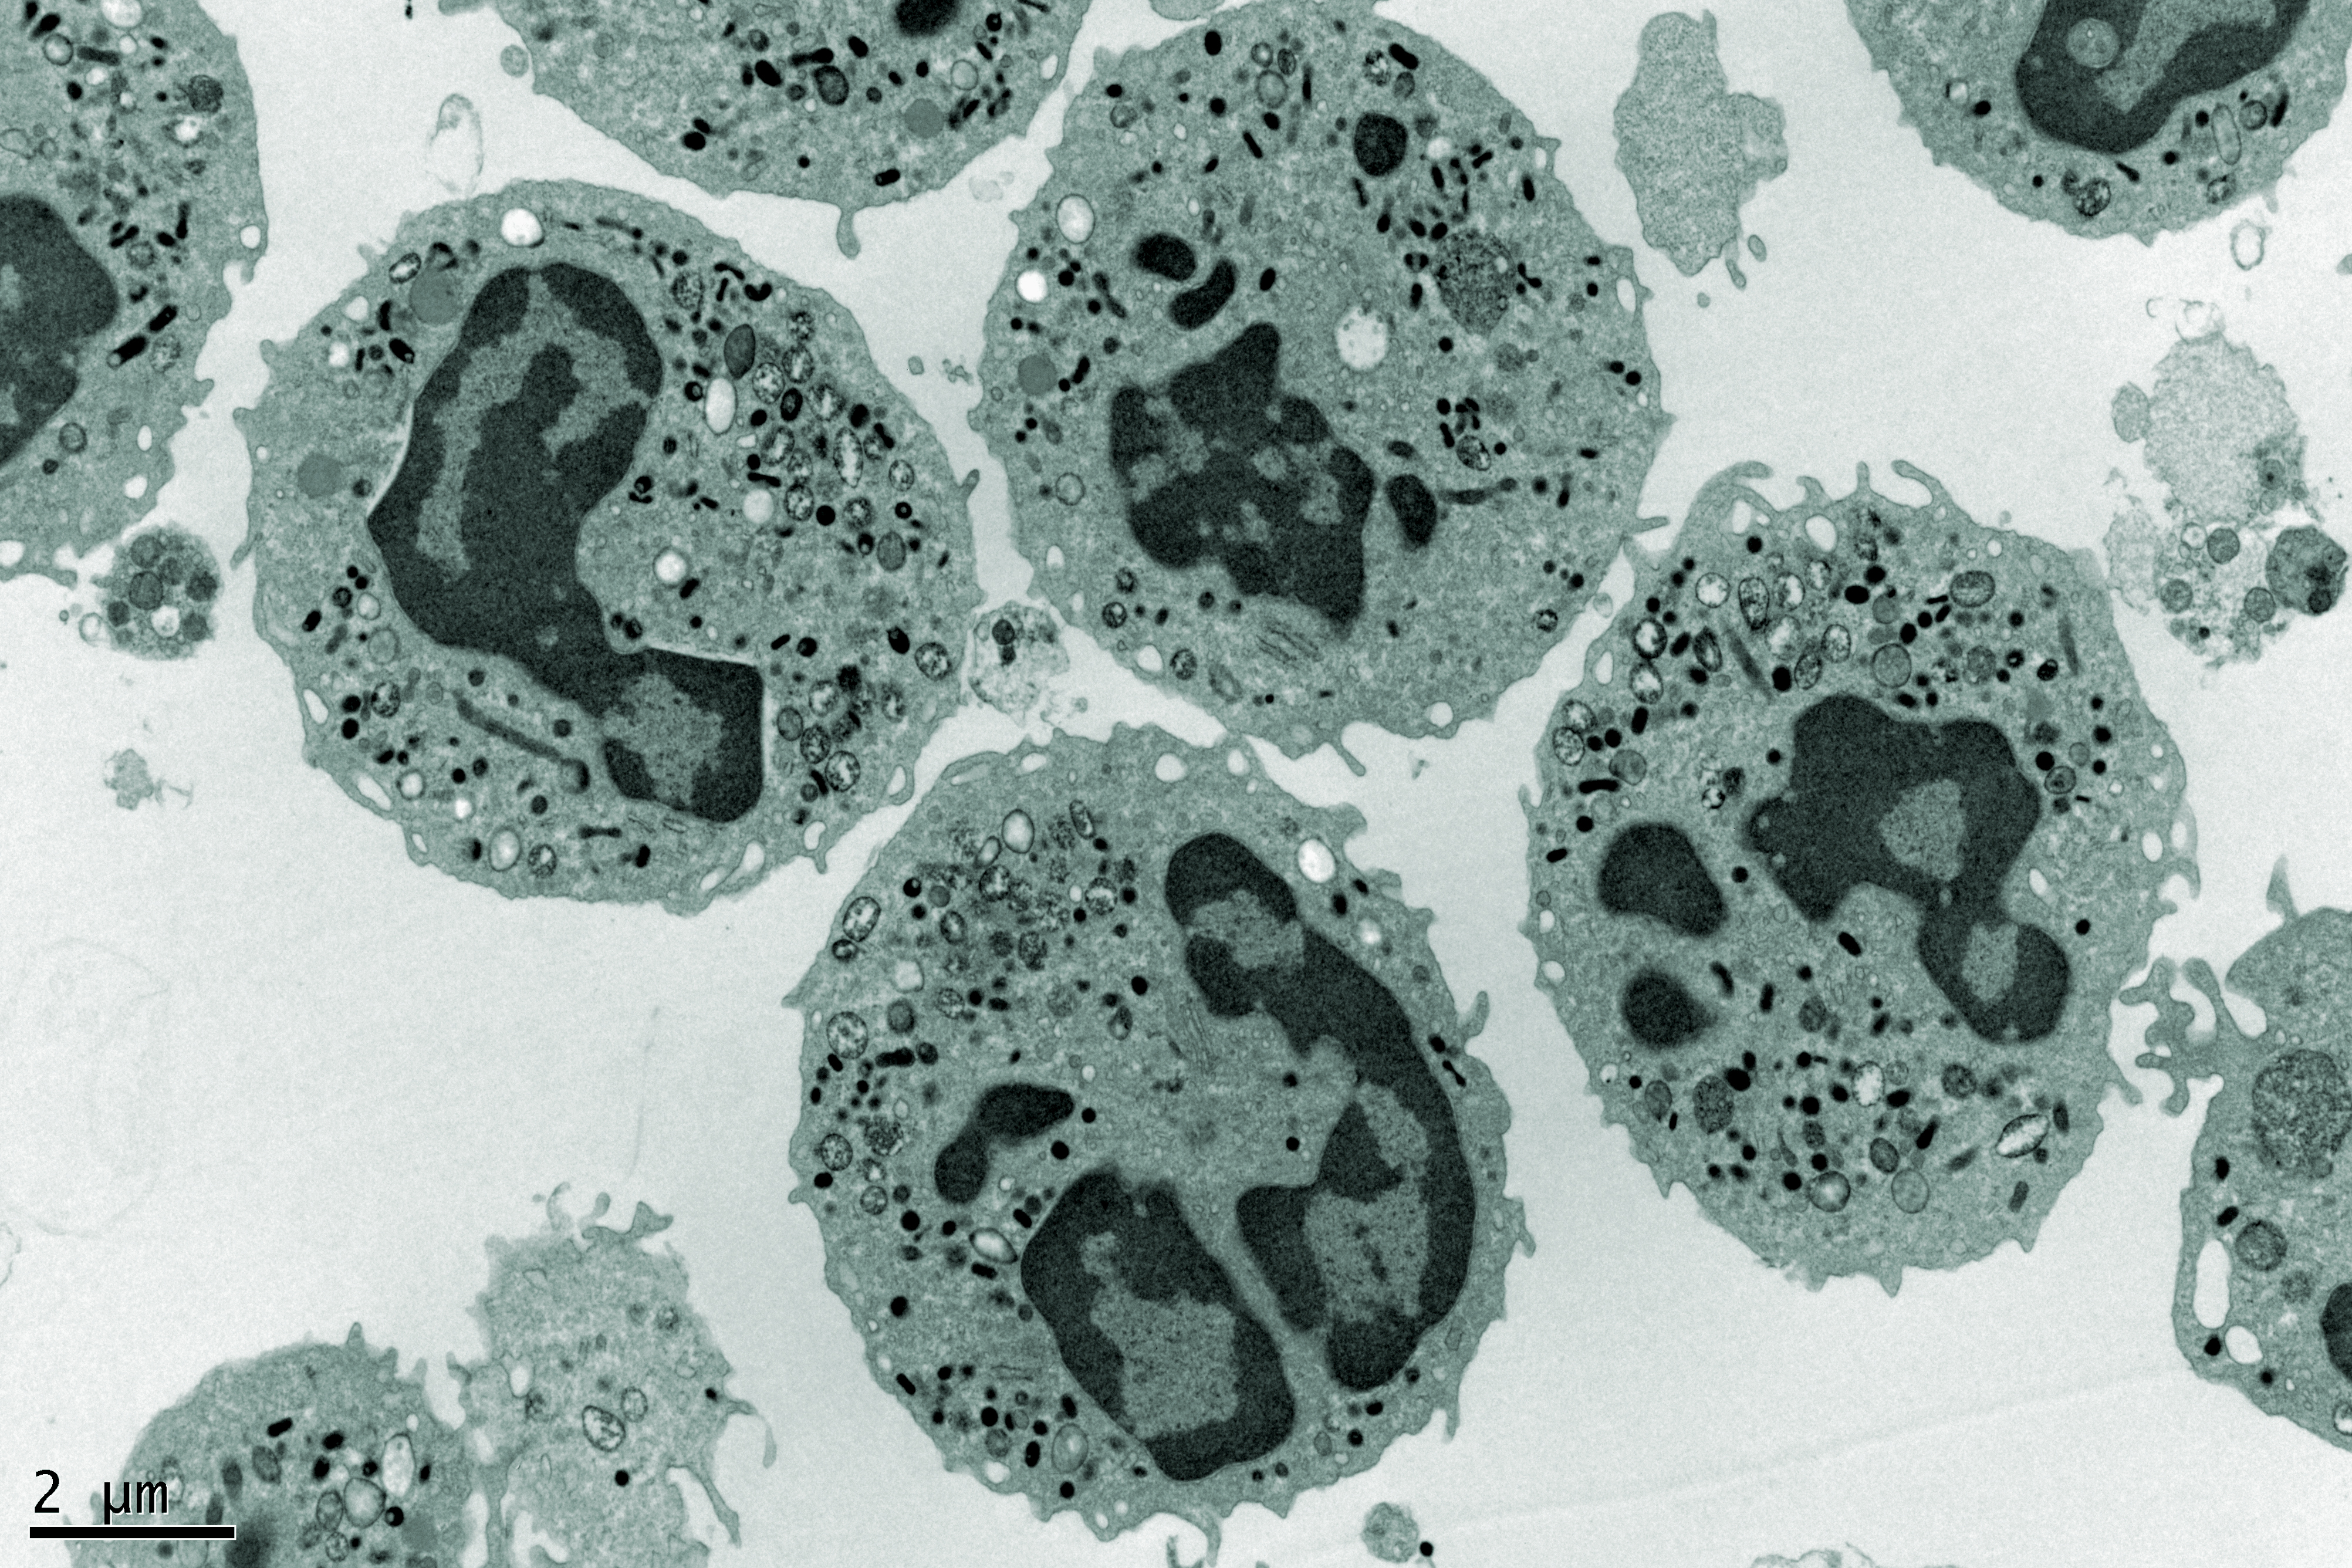
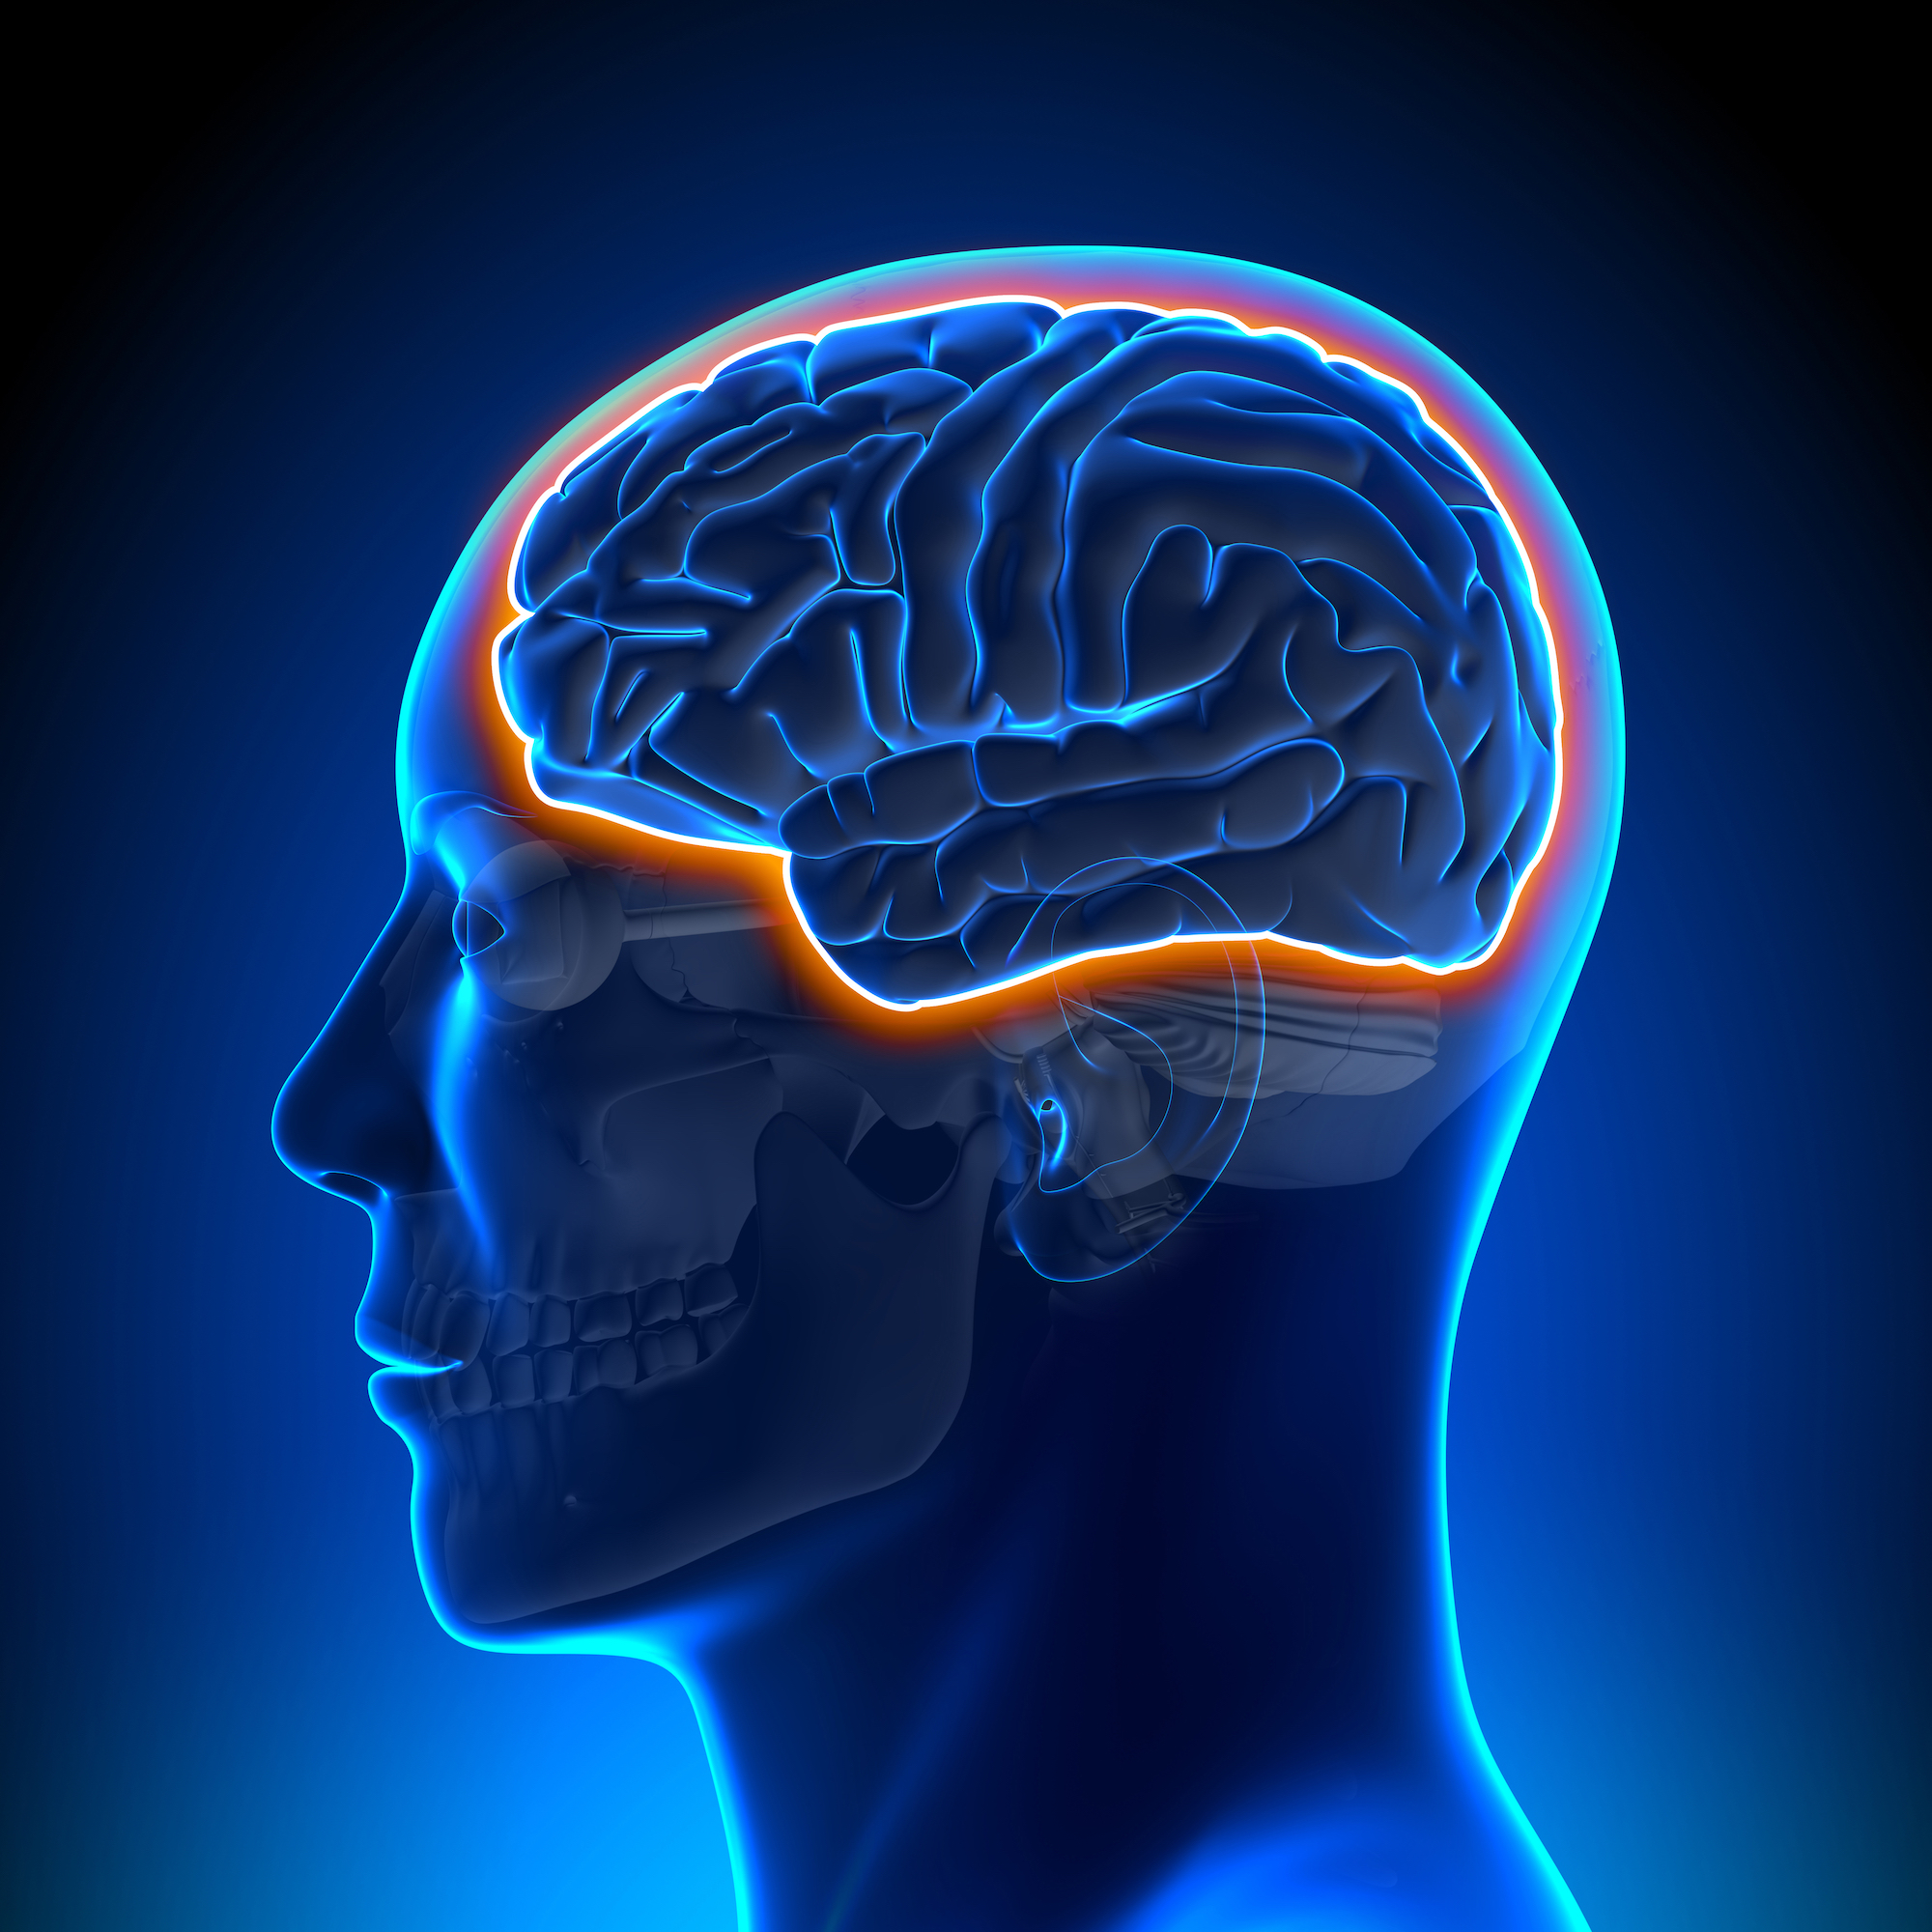
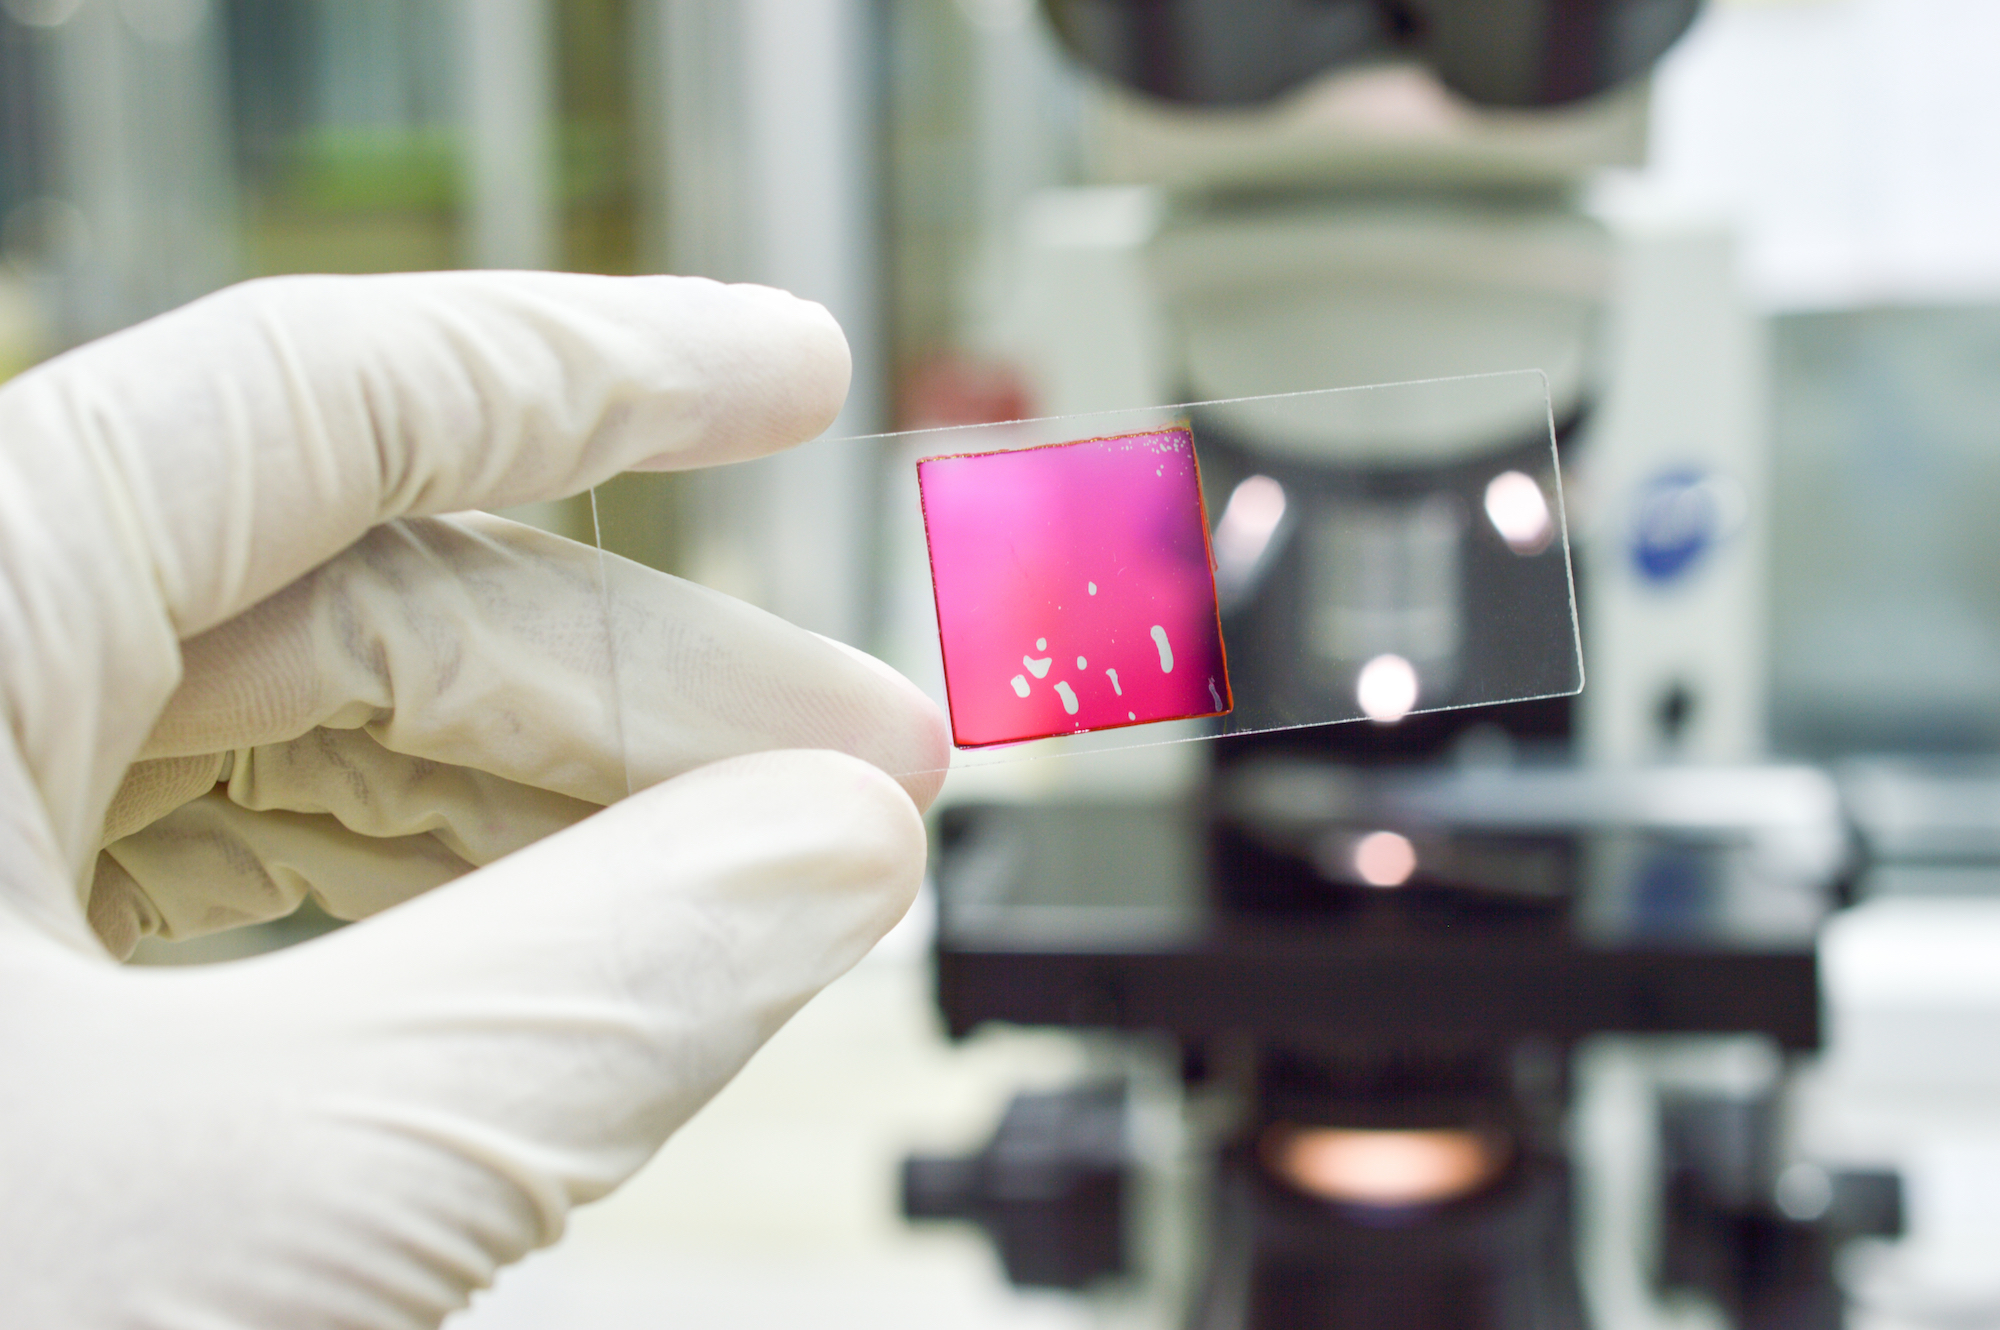
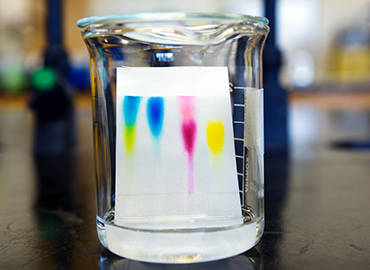
Other images such as stained cell cultures or medical images are also commonly found in biomedical texts. Figure 3, for example, displays mouse x-rays with different types of contrast.

The challenge: Classifying types of scientific figures
For the purpose of this student project, we have constructed a dataset consisting of three main types of figure listed above: tables, charts/graphs, and other images. Given this data, the challenge is to develop an approach capable of classifying unseen scientific figures as being a “table”, “chart”, or “other image”.
To ensure that this challenge is as representative of a real industry problem as possible, we have provided the data in its raw format, giving the students complete freedom to approach the problem. In a future blog post we will discuss how the students approached the problem and constructed their solution.
About the author

Adam Poulston is a Data Scientist in text analytics at Medicines Discovery Catapult.
Adam attained his Masters, in Software Engineering, from The University of Sheffield. After which he worked on numerous projects in Machine Learning and data science.
At Medicines Discovery Catapult Adam has been instrumental in the development of internal data processing, acquisition, and aggregation pipelines. Developing solutions to several novel problems in the field of scientific text analytics, by applying his knowledge of ML, NLP, and Computer Vision.


 Homepage image")